Visualization with GeneScapes Viewer

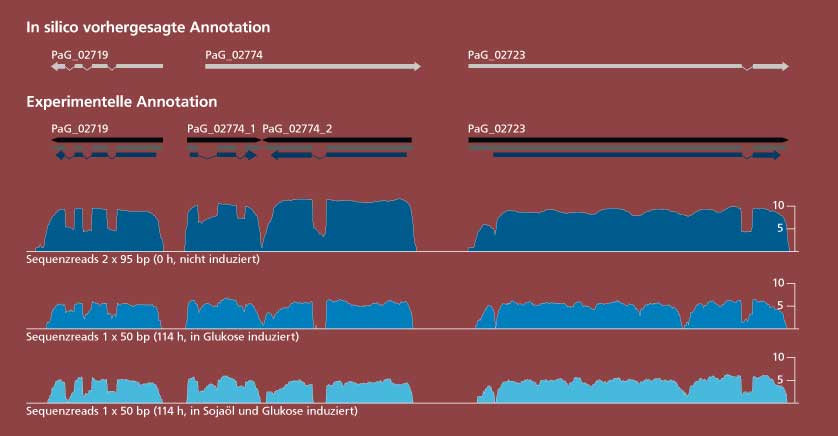
Interpretation of sequence data can often be facilitated by clearly represented visual illustration. Thus, the GeneScapes Viewer was developed at the Fraunhofer IGB – a genome browser allowing interactive and easily adaptable inspection options of different data sets. That way, we are able to analyze expression data in different resolutions, either considering whole genome sections or in far higher degrees of detail, for example at the sequence level.
Additionally, the GeneScapes Viewer offers, among other things, the function of manual (re-)annotation of transcriptionally active regions by an intuitive Annotate-by-Click concept which facilitates the generation of (novel) gene models. Beyond that, other functionalities like wiggle plots provide a fast overview of gene expression levels under different conditions.
 Fraunhofer Institute for Interfacial Engineering and Biotechnology IGB